|
|
In our previous articles, we covered the Bull Call Spread: Trading Example, Bull Put Spread: Payoff Function & Example and Bear Call Spread: Example with Payoff Charts Explained. Continuing further in our series of explaination on Options Spread Trading, in this article we detail the Bear Put Spread
Example & Payoff Function of Bear Put Spread
As the name suggests, the Bear Put Spread will be profitable to the buyer of this position when the underlying stock is bearish i.e. the underlying stock price goes down. Secondly, this Bear Put Spread will be prepared using a combination of Put Options and both the profit and loss on this Bear Put Spread trading will be limited to the extent of the spread, hence the name Bear Put Spread.How to construct a Bear Put Spread
To construct Bear Put Spread Position, we need the following Put Option Contracts:
1) Buy or LONG an ITM Put
2) Sell or Short an OTM Put

(To understand what is an ITM or OTM option, See Moneyness of Options - OTM, ATM, ITM Options to know about ATM, ITM and OTM options)
So when you have these two put option positions, what do you get? Have a look at these two positions in raw format as follows:
Let's suppose that a stock (underlying) is trading at $30 per share and you as a buyer of the Bear Put Spread want to form the spread using the put options on that underlying stock. So suppose that you take the ITM strike price as $33 and the OTM strike price as $27 for the two put options.
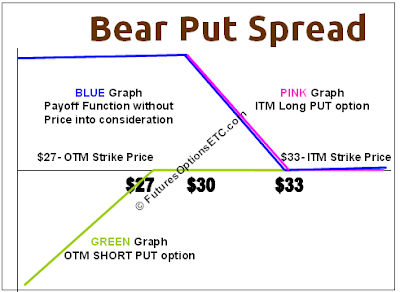
So, the OTM short put is indicated by the GREEN graph and the ITM LONG Put is displayed by the PINK graph in the raw format.
Now, let's add them together and see what we get as a BLUE graph:
Since we are dealing with Put Options, we need to start adding them from the Right hand side.
- From infinity to $33, both the graphs are at ZERO, so above $33, the sum graph will be ZERO
- From $33 to $27, the GREEN graph is ZERO, while PINK one is slanting. Adding the two in this range gives you net PINK graph
- From $27 to 0, the GREEN graph is slanting upwards, while PINK one is slanting downwards. Adding the two will give a horiszontal line.

So the net that you get is indicated by the BLUE graph (in the above mentioned three regions). This BLUE graph indicates the net Payoff Function for the Bear Put Spread. But hang on. This is NOT the realistic payoff function of the Bear Put Spread. The reason? We have not considered the net price we paid/received of the two option positions we got into.
So assume that the ITM Long Put Option will cost you $5 and OTM short Put Option position will get you $2. So the net you pay is $5 - $2 = $3 (Outflow). Now, lets account for this price into the Payoff Function for the Bear Put Spread and see the realistic graph. Proceed to next part: Trade Bear Put Spread: Option Strategy Explained

0 Comments: Post your Comments
Wish you all profitable derivatives trading and investing activities with safety! = = Post a Comment