|
|
Theoretically, here is how it will look:

Suppose the IBM stock is trading at $50 per share (the underlying price) and it is expected to make a big move in either direction in next 3 months time (say based upon earnings reports or project bidding outcome or business plan expansion or any other reason). If things go well, then the stock price will shoot up to $80 and if things don’t go well, then the stock price can fall to $20 or so in the next 3 months. This makes an ideal scenario to trade Long Strangle Options on IBM (just an example). So you as an option trader take the following positions in IBM options
1) OTM Long Put - $40 strike price for the price of $3
1) OTM Long Call - $60 strike price for the price of $3
So total you pay $3 + $3 = $6 as a net option premium for the Long Strangle position.
Related: Video Tutorial Long Strangle Option Trading
An example of Long Strangle Option Trading
Overall, this is how your option positions will look:
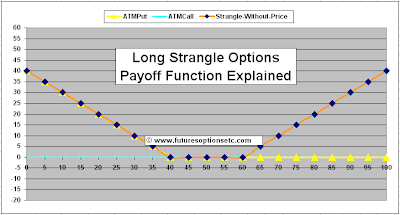
Now, let's add these 2 individual positions to get the NET ORANGE colored payoff function of Long Strangle Option - note that price is still not considered:

Finally, let's make the adjustment for the net price of $6 you paid to construct this Long Strangle Option Position and here we get the PINK colored final net payoff function for Short Straddle Option with price factored in:

So basically, what you get to know from the PINK colored final payoff chart is the following:
- You will be in a net loss if the IBM stock price stays in the region of $34 to $66 price range (you also need to deduct the option brokerage)
- The losses will be flat at $6 in the $40 to $60 region
- The Losses will change linearly in the ($34 to $40) and in the ($60 to $66) region
- You will be in profit only if the IBM stock price moves above $66 or goes below $34 (minus the option brokerage & commissions)
- The profits will always be linear and will increase linearly in the profit region

0 Comments: Post your Comments
Wish you all profitable derivatives trading and investing activities with safety! = = Post a Comment