|
|
But how do we quantify risk?
For the moment, let’s only confine our discussion to stocks and investments, as this article is a tutorial about financial investment and trading activities.
In a simplest way, let’s assume that there is a stock that is available for free – means, the price of that stock is zero. Also assume that there are no brokers involved in the transaction and we don’t have to pay any security transaction taxes. To make the discussion easy, let’s name the stock – let’s call it GOOGOL.
So, you buy this googol stock for zero dollars today (date 7th September). Hence, you will have this position:
| Buy Price | 0 | |
| Date | Stock Price | Profit/Loss (Stock price- Buy Price) |
| 07-Sep-07 | 0 | 0 |
Since you bought this stock for zero on 7th September, and the price stayed at zero for the whole day, your profit/loss will be zero.
Suppose, tomorrow on 8th September, the price rises to 1 dollar. So we will have the following situation:
| Buy Price | 0 | |
| Date | Stock Price | Profit/Loss (Stock price- Buy Price) |
| 07-Sep-07 | 0 | 0 |
| 08-Sep-07 | 1 | 1 |
With respect to the buying price of zero, your profit/loss on 8th September will be 1, because the stock price has gone upto 1.
Suppose, the next day on 9th September, the price rises to 2 dollars. Then we will have the following situation.
| Buy Price | 0 | |
| Date | Stock Price | Profit/Loss |
| 07-Sep-07 | 0 | 0 |
| 08-Sep-07 | 1 | 1 |
| 09-Sep-07 | 2 | 2 |
Suppose, even negative prices are possible. So, if the next day, on 10th September, the price falls from 2 dollars to -1 dollars, then we will have:
| Buy Price | 0 | |
| Date | Stock Price | Profit/Loss |
| 07-Sep-07 | 0 | 0 |
| 08-Sep-07 | 1 | 1 |
| 09-Sep-07 | 2 | 2 |
| 10-Sep-07 | -1 | -1 |
Therefore, our profit and loss will move as per our Stock price movement, as listed in the above table.
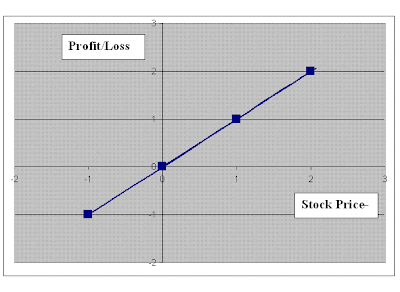
Now, let’s draw a graph for the Stock Price and Profit/Loss. We will have the following:

As you can observe, that we have plotted the Stock price values on the horizontal axis (x-axis), and the profit/loss values on the vertical axis (y-axis) – and we arrive at the above graph. The negative values on vertical axis indicate loss, while positive values indicate profits.
Let's head over to the next part Options Payoff Functions Continued

0 Comments: Post your Comments
Wish you all profitable derivatives trading and investing activities with safety! = = Post a Comment