|
|
Continuing further from our previous article The Mathematics of Payoff Functions, in this article we will cover more examples on Payoff Function for Options Trading.
Example 2)
Suppose you buy a Call Option on Microsoft stock with strike price $45 and a Put Option on Microsoft Stock with a strike Price of $55.
There are 2 Buys here and suppose you pay $7 for the call option and $8 for the Put option.
Let's start the step by step procedure to build the payoff function for this set of options.
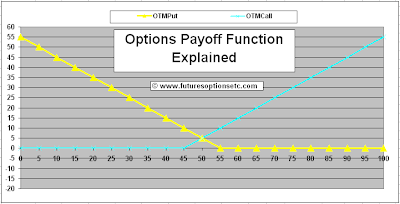
1) Start with the individual payoff functions for each of these 2 option positions with ZERO price consideration. The BLUE TURQUOISE payoff function is for the LONG CALL option and the YELLOW payoff function is for the LONG PUT option.

2) Now, add the two payoff functions. To do that, identify the different regions where the two graphs are changing.
Look closely at the above graph.
- The Turquoise call payoff function is ZERO from 0 to 45 (flat turquoise line from 0 to 45).
- The Turquoise call payoff function then starts SLANTING UPWARDS from $45 onwards and increases linearly.
- The yellow put payoff function is ZERO from 55 to higher value (flat yellow line from 55 to 100 and above)
- The yellow put payoff function is SLANTING DOWNWARDS between 0 and 55 linearly.
Based on the above, we have 3 regions where the 2 payoff functions change orientation and magnitude with respect to each other :
- Between 0 an 45
- Between 45 and 55
- Above 55
While adding the payoff functions, you need to look at the sum total region wise:
- Between 0 an 45:
Turquoise call payoff function is ZERO. Yellow Put Payoff function is downward slanting. So adding the two will result only in Yellow Payoff function. (You are adding zero to x, the result is x)
(See the payoff function chart below - net sum is indicated by the ORANGE colored downward slanting line between $0 and $45)
- Between 45 and 55:
Turquoise call payoff function is upward slanting. Yellow Put Payoff function is downward slanting. The two slanting directions (negative and positive) cancel each other and hence we get a net zero slope horizontal line.
But where to place this net zero slope horizontal line? For that, you need to add ATLEAST one individual value set of the two graphs. For e.g. if you take the horizontal value of $45, at that value, the Turquoise graph is Zero, while Yellow graph is $10. Hence ($0 + $10 = $10) is the height at which this horizontal line should be place.
Take another point, say $55. At this, the Turquoise graph is $10, and yellow graph is $0. Adding them again gives $10.
Or say at $50, Turquoise graph is $5 and yellow graph is again $5. Adding them gives $10.
Hence in this region, the net payoff function will be a horizontal line at the height of $10. (See below - indicated by the ORANGE colored horizontal line between $45 and $55)
- Above 55
Turquoise call payoff function is upward slanting. Yellow Put Payoff function is ZERO. So adding the two will result only in Turquoise Payoff function. (You are adding zero to x, the result is x)
(See the payoff function chart below - net sum is indicated by the ORANGE colored upward slanting line from $55 and above)
So net net, this ORANGE colored graph gives you the net payoff function for this call and put combination.

As a next step, lets adjust for the price also. You pay $7 for the call option and $8 for the Put option, meaning a net outflow of $15 for this combination. Since it’s a net OUTflow, we need to bring DOWN the orange payoff function by this amount. That leads us to the final payoff function PINK Colored.

So what does this final PINK colored payoff function tell us? It clearly tell us about the profit and loss regions. Any region of the PINK payoff function which is below the horizontal axis is loss region (Between $40 and $60). Any region for which the pink payoff function is above the horizontal axis is profit region (below $40 to $0 and above $60 to infinity). So drawing correct payoff functions with multiple option positions helps in getting a clear and complete picture of the entire holdings.
But do note that you will also have to account for Options Trading Brokerage and Commission charges. Since it is a cost (net outflow) the PINK colored payoff function should be brought down further. Assuming you pay $0.5 for each leg of trade, the total brokerage will be $2 ($0.5 + $0.5 for buying and $0.5 +$0.5 for selling the 2 options)
Believe this is becoming clear now. But there are a few further complexities involved for some more cases.
What to do when you have multiple Long and short positions in multiple call and put options on the same underlying? Things are simple, but you need to take some extra steps while adding such multiple positions. What are those steps? See following: Mathematics of Options Trading

0 Comments: Post your Comments
Wish you all profitable derivatives trading and investing activities with safety! = = Post a Comment