|
|
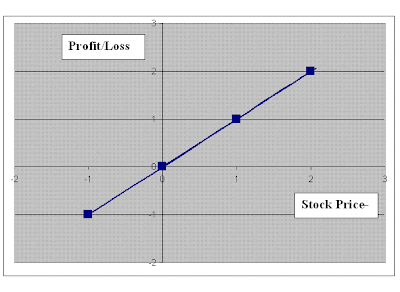
Remember the first graph, which was introduced with a ZERO buy Price? Here it is:

Then, remember the 2nd graph where we assumed a buy price of 50 dollars? Here it is:

Now suppose we draw these 2 graphs on the same sheet, and extend the price ranges, we get the following:
 .
.Let's head over to the next part Payoff Functions Summary & Conclusions

0 Comments: Post your Comments
Wish you all profitable derivatives trading and investing activities with safety! = = Post a Comment